

ROC
dan Momentum sebenarnya kedua indikator ini adalah serupa. Sama-sama
indikator yang berfungsi sebagai perbandingan terhadap harga yang lalu
dan sama-sama memiliki pattern yang sama.
Perbedaannya hanya pada cara penghitungannya. Kalau pada ROC perhitungan dilakukan dengan membandingkan harga sekarang dengan harga pada periode yang lalu, pada momentum perhitungan dilakukan dari selisih harga sekarang dengan harga pada periode lalu.
Secara matematis ROC dan Momentum ditulis sebagai berikut:

X = Closing price sekarang
Y = Closing price waktu yang lalu sesuai periode yang ditentukan
Nah, hampir sama bukan? Yang satu di bagi yang satu dikurangi. Hasilnya terlihat pada gambar dibawah ini. Sama persis pattern yang terbentuk, hanya saja nilainya tentu saja berbeda.
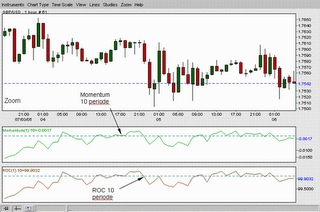
Jadi sebenarnya kegunaan kedua indikator ini sama persis satu sama lainnya. Mungkin nilainya saja yang berbeda sehingga batasannya akan berbeda untuk overbought / oversold. Namun dalam penafsirannya adalah sama dan kembali pada Anda mana yang lebih Anda sukai. Jika Anda menyukai dalam bentuk persentase, gunakan ROC dan sebaliknya bila yang diinginkan adalah bentuk nol koma sekian-sekian, gunakan momentum.
Supaya Anda semakin jelas saya berikan contoh perhitungannya. Pada contoh ini, periode yang saya pakai adalah 10.
Perbedaannya hanya pada cara penghitungannya. Kalau pada ROC perhitungan dilakukan dengan membandingkan harga sekarang dengan harga pada periode yang lalu, pada momentum perhitungan dilakukan dari selisih harga sekarang dengan harga pada periode lalu.
Secara matematis ROC dan Momentum ditulis sebagai berikut:
X = Closing price sekarang
Y = Closing price waktu yang lalu sesuai periode yang ditentukan
Nah, hampir sama bukan? Yang satu di bagi yang satu dikurangi. Hasilnya terlihat pada gambar dibawah ini. Sama persis pattern yang terbentuk, hanya saja nilainya tentu saja berbeda.

Jadi sebenarnya kegunaan kedua indikator ini sama persis satu sama lainnya. Mungkin nilainya saja yang berbeda sehingga batasannya akan berbeda untuk overbought / oversold. Namun dalam penafsirannya adalah sama dan kembali pada Anda mana yang lebih Anda sukai. Jika Anda menyukai dalam bentuk persentase, gunakan ROC dan sebaliknya bila yang diinginkan adalah bentuk nol koma sekian-sekian, gunakan momentum.
Supaya Anda semakin jelas saya berikan contoh perhitungannya. Pada contoh ini, periode yang saya pakai adalah 10.
| No | Closing Price | ROC | Momentum |
| 1 | 1.7632 | - | - |
| 2 | 1.7598 | - | - |
| 3 | 1.7604 | - | - |
| 4 | 1.7635 | - | - |
| 5 | 1.7698 | - | - |
| 6 | 1.7701 | - | - |
| 7 | 1.7712 | - | - |
| 8 | 1.7765 | - | - |
| 9 | 1.7750 | - | - |
| 10 | 1.7732 | - | - |
| 11 | 1.7725 | = (1.7725/1.7632) x 100 = 100,52745 | = 1.7725 – 1.7632 = 0,0093 |
| 12 | 1.7724 | 100,71599 | 0,0126 |
| 13 | 1.7736 | 100,74983 | 0,0132 |
| 14 | 1.7798 | 100,924298 | 0,0163 |
| 15 | 1.7780 | 100,463329 | 0,0082 |
Mungkin
bagi Anda yang sudah sering bermain dengan saham atau menggunakan
source lain agak bingung dengan rumus yang saya kemukakan diatas karena
beberapa buku atau web menyebutkan rumus ROC (misal dengan periode 10)
tidak demikian namun seperti ini :
Untuk memudahkan penjelasan, akan saya terangkan penggunaan indikator Momentum. Mengenai ROC, akan sama dalam penggunaannya dengan momentum, begitu juga dengan peraturan-peraturan yang berlaku.
Using the Momentum Pernah belajar Fisika waktu SMP atau SMA dulu? Jika pernah, pasti kita pernah diberikan materi mengenai hukum Newton. Salah satu hukum tersebut membahas mengenai inersia benda-benda yang bergerak.
Maksudnya begini, jika sebuah benda yang sedang bergerak oleh karena sebuah gaya dikenakan padanya, maka setelah gaya pendorong tersebut tidak lagi dikenakan pada benda tersebut, benda tidak langsung berhenti tetapi kecepatannta akan berkurang secara perlahan-lahan sampai berhenti sama sekali. Ini terjadi karena adanya sifat inersia pada benda tersebut.
Inersia sendiri didefinisikan sebagai keberadaan sebuah benda untuk tetap mempertahankan posisi dirinya terhadap titik acuan tertentu. Bila benda tersebut bergerak maka dia akan terus bergerak jika tidak ada gaya yang menghambatnya (dibumi gaya penghambatnya adalah gaya gesek). Besarnya berbanding lurus dengan konstanta dan massa benda dan dikalikan dengan kuadrat jari-jarinya.
Ok, kita tidak berlama-lama dengan fisika. Kita sedang berusaha mencari uang disini, bukan sedang sekolah. Namun, demikianlah yang terjadi pada pergerakan sebuah harga. Jika gaya pendorong harga untuk naik/turun sudah berkurang atau bahkan tidak ada lagi, maka trend tidak begitu saja berhenti dan segera berbalik, namun akan berkurang perlahan-lahan sampai akhirnya baru berhenti total karena gaya ‘inersia-nya’ (tentu saja bukan inersia betulan karena ini harga bukan benda yang punya jari-jari!!).
ROC dan momentum digunakan untuk mengukur laju pergerakan ini. Jika sebuah trend akan segera berakhir maka momentum pergerakan akan berkurang sampai akhirnya menembus centerline-nya yang menandakan trend sudah berlalu dan digantikan dengan trend yang baru.
Salah satu kelebihan pada kedua indikator ini adalah kemampuannya untuk melihat apa yang kemungkinan terjadi didepan karena dapat memberikan sinyal yang lebih dahulu akan pengurangan momentum yang akan diikuti oleh berakhirnya trend dan perubahan arah. Namun demikian, sama seperti RSI yang memiliki kelebihan dengan kesensitifannya, maka kedua indikator ini pun memiliki kelemahan sehingga tidak boleh digunakan sebagai indikator utama untuk penentuan buy/sell. ROC dan momentum lebih baik digunakan sebagai approval dari indikator lainnya guna menguatkan hasil analisa kita mengenai apa yang akan segera terjadi.
Kegunaan lain dari kedua indikator ini adalah untuk mengetahui kondisi overbought /oversold yang berarti akan segera terjadi perubahan arah harga. Harap diingat selalu perubahan arah harga tidak akan terjadi sampai indikator meninggalkan area overbought/ oversell yang kita buat. Dan kembali jangan dilupakan bahwa batasan overbought/ oversold disini nilainya dapat saja berbeda antara pair satu dengan pair lainnya bahkan sebuah pair pun dapat bebeda dari waktu ke waktu dalam area ini. Singkatnya apabila batasan overbought /oversold yang kita buat sudah seringkali menimbulkan false signal, itu saatnya kita menentukan batasan yang baru.
Perhatikan gambar dibawah ini:
Untuk batasan kali ini saya memakai -0.0004 untuk batasan oversold dan 0.0005 untuk batasan overbought. Silakan bereksperiman untuk menentukan batasan-batasan lainnya.
Lalu apakah gunanya centerline pada indikator ini? Kegunaan centerline pada momentum sebenarnya sama dengan garis 50 pada RSI. Hanya saja terus terang dibandingkan RSI yang cukup valid, penembusan garis momentum terhadap centerline seringkali menimbulkan false signal. Itu sebabnya jarang sekali centerline ini dipakai. Namun tidak ada salahnya jika mau Anda coba.
Pertanyaan lainnya yang sama adalah bisakah kita mengurangi false signal pada momentum dan ROC dengan memberikan MA pada mereka? Tentu saja bisa. Selain dengan pemilihan periode yang tepat, sangat disarankan indikator ini juga dimuluskan dengan memakai MA periode kecil. Perhatikan contoh dibawah ini:
Pada daerah yang saya berikan lingkaran oranya tampak seolah-olah momentum sedang menembus centerline yang berarti akan terjadi perubahan arah pergerakan harga karena berakhirnya momentum bearish. Namun jika kita memberikan MA dengan 5 periode terlihat bahwa sebenarnya ini hanyalah false signal. Terbukti pada pukul 05.00 (diberi garis biru), harga malah kembali turun bahkan menurun drastis menuju 1.2082 dari sekitar 1.2180. Ini berarti penurunan sebanyak 100 point. Cukup besar pengaruhnya bila dalam real account.
Source : http://belajarforex.com
------------------------------------------------------
ENGLISH VERSION :
ROC and the second the actual Momentum indicators are similar. Equally indicator serves as a comparison to the price of the past and both have the same pattern.
They differ only in the counting. If the ROC calculation is done by comparing the current price with the price in the last period, the momentum calculation is made of the difference between the current price with the price in the previous period.
ROC and Momentum mathematically written as follows:
X = Closing price now
Y = Closing price and appropriate period of time determined
Well, almost the same right? The one on the reduced one. The results are shown in the figure below. Exactly the same pattern is formed, only the value of course different.
So the actual usefulness of these two indicators is exactly the same with each other. It may be a different value so that the limit will be different for overbought / oversold. However, the interpretation is the same and get back to you which one you like better. If you love in the form of percentages, use the ROC and reverse when desired is a form of zero point for so-so, use the momentum.
Maybe for those of you who have often played with the stock or using another source bit confused with the formula that I mentioned above because some book or web mentions formula ROC (ie the period of 10), but such is not the case:
ROC = 100 * (Today's close - Close 10 periods ago) / (Close 10 periods ago)
Some external website does mention the above formula with the ROC, but actually it is the P ROC is Price Rate of Change. At P ROC comparison not only with the distribution of prices is taken now with the last period, but more like the formula of the efficiency of the closing prices are now less then a new period divided by the price of past period and multiplied by 100. This method is legitimate and which one you like please use. Which obviously apologize if I did not show P ROC chart here because it was not available for the www.netdania.com and anyway have the same interpretation with momentum or ROC which I will explain below.
For ease of explanation, I will explain the use of the Momentum indicator. Regarding the ROC, will be equal to the momentum in their use, as well as rules and regulations.
Using the Momentum been studying physics in junior high or high school? If so, surely we've given the material about Newton's laws. One of the laws is to discuss about the inertia of moving objects.
That way, if an object is moving because a force is applied to it, then after the propulsive force is no longer subject to the object, the object is not stopped but kecepatannta will be reduced gradually until it stops altogether. This is due to the nature of the inertia of the object.
Inertia itself is defined as the presence of an object to maintain his position against a particular reference point. If the object is moving then he will continue to move if there is no force that hinders (the earth is inhibiting force of friction). Proportional to the mass of the body and the constant and multiplied by the square of the radius.
Ok, we did not linger with physics. We're trying to make money here, not studying. However, such is the case at a price movement. If the driving force prices to go up / down is reduced or even no more, the trend does not just stop and immediately turned around, but it will decrease slowly until finally stopped completely because the style 'of his inertia' (of course not the real inertia because the price is not a thing that has fingers!).
ROC and the momentum is used to measure the rate of movement. If a trend is coming to an end then the momentum of the movement will be reduced until it finally broke centerline indicating the trend is gone and replaced with a new trend.
One of the advantages to the second indicator is the ability to see what is likely to occur in front because it can provide a signal that will advance the reduction of the momentum that will be followed by the end of the trend and changes of direction. However, just as RSI which has advantages with heightened sensitivity, these two indicators also has the disadvantage that should not be used as a leading indicator for the determination of the buy / sell. ROC and momentum are better used as an approval of the other indicators in order to corroborate the results of our analysis of what is going to happen.
Other uses of these two indicators is to determine overbought / oversold which means it will soon change in price direction. Please remember always change in price direction will not occur until the indicator left the overbought area / oversell we make. And again do not forget that the restriction overbought / oversold here value can be different between one pair with another pair and even a pair can be bebeda from time to time in this area. In short if the restriction overbought / oversold that we make are often cause false signals, it's time for us to define new limits.
Note the picture below:
To limit this time I wear -0.0004 to 0.0005 to limit boundaries oversold and overbought. Please experiment to determine the limits of the other.
Then what is the use centerline on this indicator? Usability centerline on that momentum with line 50 on RSI. It's just frankly pretty valid comparison RSI, momentum against the centerline line penetration often cause false signals. That's why this centerline rarely used. But there is no harm if you want to try.
Other similar questions is can we reduce false signals on momentum and ROC to give MA to them? Sure you can. In addition to the selection of the appropriate period, these indicators are also strongly advised to use the MA smoothing small period. Consider the example below:
In the area that I give oranya circle looked as if the momentum is penetrating centerline which will mean a change in direction of price movement since the end of the bearish momentum. But if we provide MA with 5 periods shows that in fact this is just false signals. Proven at 05.00 (given the blue line), prices actually fell back towards 1.2082 and even dropped dramatically from about 1.2180. This means a decrease of 100 points. Quite a big influence when the real account.
Source: http://belajarforex.com
Tidak ada komentar:
Posting Komentar